Future Generations Thriving: A Green New Deal for Seattle

By Got Green & Puget Sound Sage
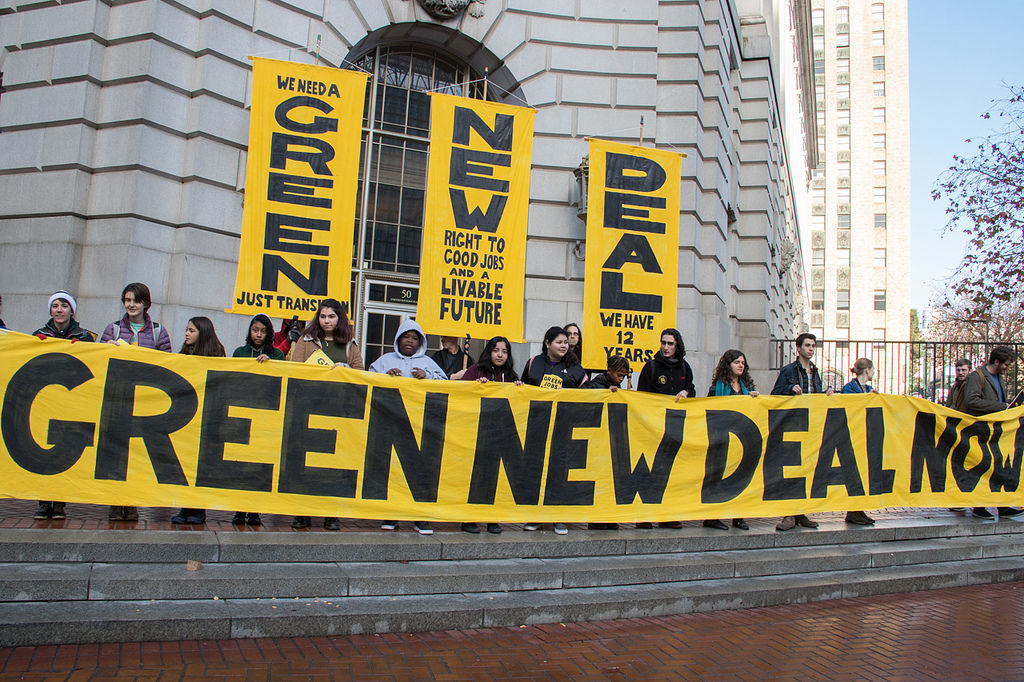
Photo by Peg Hunter

Got Green and Puget Sound Sage are excited by the opportunity the Green New Deal presents to build good jobs, clean our air and water, and leave a healthy planet for future generations. We know what a Green New Deal looks like locally, because we’ve been working on it in coalition with our partners at SouthCORE, Front & Centered, and The Alliance for Jobs and Clean Energy.

Community control of development, affordable housing, rooted communities, living-wage jobs, public transportation, healthy food, renewable energy, clean air, water, and land, and corporate accountability are the components of a Green New Deal. Community connection is how people survive and bounce back from emergencies. Strengthening community cohesion is a climate adaptation and resilience strategy.

Got Green and Puget Sound Sage recommend substantial investment from the federal, state, and local level to kick start, support, and scale up frontline community-led work on:

Living-wage jobs that benefit or conserve the environment and preserve or expand environmental health for workers and the surrounding community

Living-wage and unionized jobs in the renewable energy and building trades sectors

Renewable, local energy infrastructure, including solar, wind, battery-storage, and other community-owned and -driven energy solutions

Rapid, convenient, affordable, and electrified public transportation

Energy-efficient, affordable housing and capacity to weatherize existing housing stock

Support for workers and businesses transitioning out of the fossil fuel industry and into renewable energy or other industries, including job training and pension security

Support with energy bills, weatherization, and transportation costs for low-income people

Subsidies going to support the fossil fuel industry must be phased out and reinvested into renewable energy. Resource investment and infrastructure development must prioritize communities most impacted by the damaged climate and ongoing pollution. Also, frontline communities need to have power over how development occurs and how resources are deployed because they know what solutions will be most effective at addressing the problems in their community.

A Green New Deal for Seattle must not include cap-and-trade or carbon market-based policies, harmful geotechnologies, or energy produced from fracked gas and nuclear power. Cap-and-trade policies do not eliminate carbon emissions 1 2 3, fracked gas produces unacceptable carbon emissions 4 5 and earthquakes 6 7, and nuclear power produces deadly byproducts 8 9 10.

All of these policies and fuel sources harm frontline communities and workers at sites of extraction and production, and pollute our air, water, and land. Their use is unnecessary when we have renewable energy options increasingly available for our use and development.

We have a plan for how to build healthy, resilient communities in Seattle and beyond. We call on our city to set an example for the nation by modeling what it looks like to invest in and follow the lead of local communities on the frontlines of climate change and ongoing pollution.

Join us in building a future we are proud to pass on to our children.


See more of Peg Hunter’s photos here. Photo license: https://creativecommons.org/licenses/by-nc/2.0/

1 Four Years In, What Can We Learn from California’s Cap and Trade Program, Front and Centered, 2016, https://frontandcentered.org/four-years-in-what-can-we-learn-from-californias-cap-and-trade-program/. Accessed 20 Mar. 2019.

2 Cushing L, et. al., A Preliminary Environmental Equity Assessment Of California’s Cap-and-Trade Program, – USC Dornsife.” 2016, https://dornsife.usc.edu/PERE/enviro-equity-CA-cap-trade.

3 Cushing L, Blaustein-Rejto D, Wander M, Pastor M, Sadd J, et al. (2018) Carbon trading, co-pollutants, and environmental equity: Evidence from California’s cap-and-trade program (2011–2015). PLOS Medicine 15(7): e1002604. Retrieved September 2018, https://doi.org/10.1371/journal.pmed.1002604

4 Fracked Gas, PSR – Physicians for Social Responsibility. https://www.psr.org/issues/environment-health/fracked-gas/. Accessed 20 Mar. 2019.

5 Howarth, R.W., Santoro, R. & Ingraffea, Methane and the greenhouse-gas footprint of natural gas from shale formations, A. Climatic Change (2011) 106: 679. https://doi.org/10.1007/s10584-011-0061-5, https://link.springer.com/content/pdf/10.1007%2Fs10584-011-0061-5.pdf.

6 Ellsworth, W.L., Injection-Induced Earthquakes, Science, Jul 2013, Vol. 341, Issue 6142, 1225942. DOI: 10.1126/science.1225942

7 National Research Council. 2013. Induced Seismicity Potential in Energy Technologies. Washington, DC: The National Academies Press. https://doi.org/10.17226/13355. https://www.nap.edu/catalog/13355/induced-seismicity-potential-in-energy-technologies.

8 Barron, R.W, Hill, M.C., A wedge or a weight? Critically examining nuclear power’s viability as a low carbon energy source from an intergenerational perspective, Energy Research and Social Science Vol. 50, 7-17, 2019, https://doi.org/10.1016/j.erss.2018.10.012.

9 Wheatley S., Sovacool, B., Sornette, D., Of Disasters and Dragon Kings: A Statistical Analysis of Nuclear Power Incidents and Accidents, Risk Analysis, Vol. 37 Issue 1, 99-115, 2017,  https://doi.org/10.1111/risa.12587

10 Nuclear Power and the Environment – Energy Explained, U.S. Energy Information Administration, https://www.eia.gov/energyexplained/index.php?page=nuclear_environment., 2019

The Massive Net Benefits of I-1631

By Debolina Banerjee, Katrina Peterson & Howard Greenwich

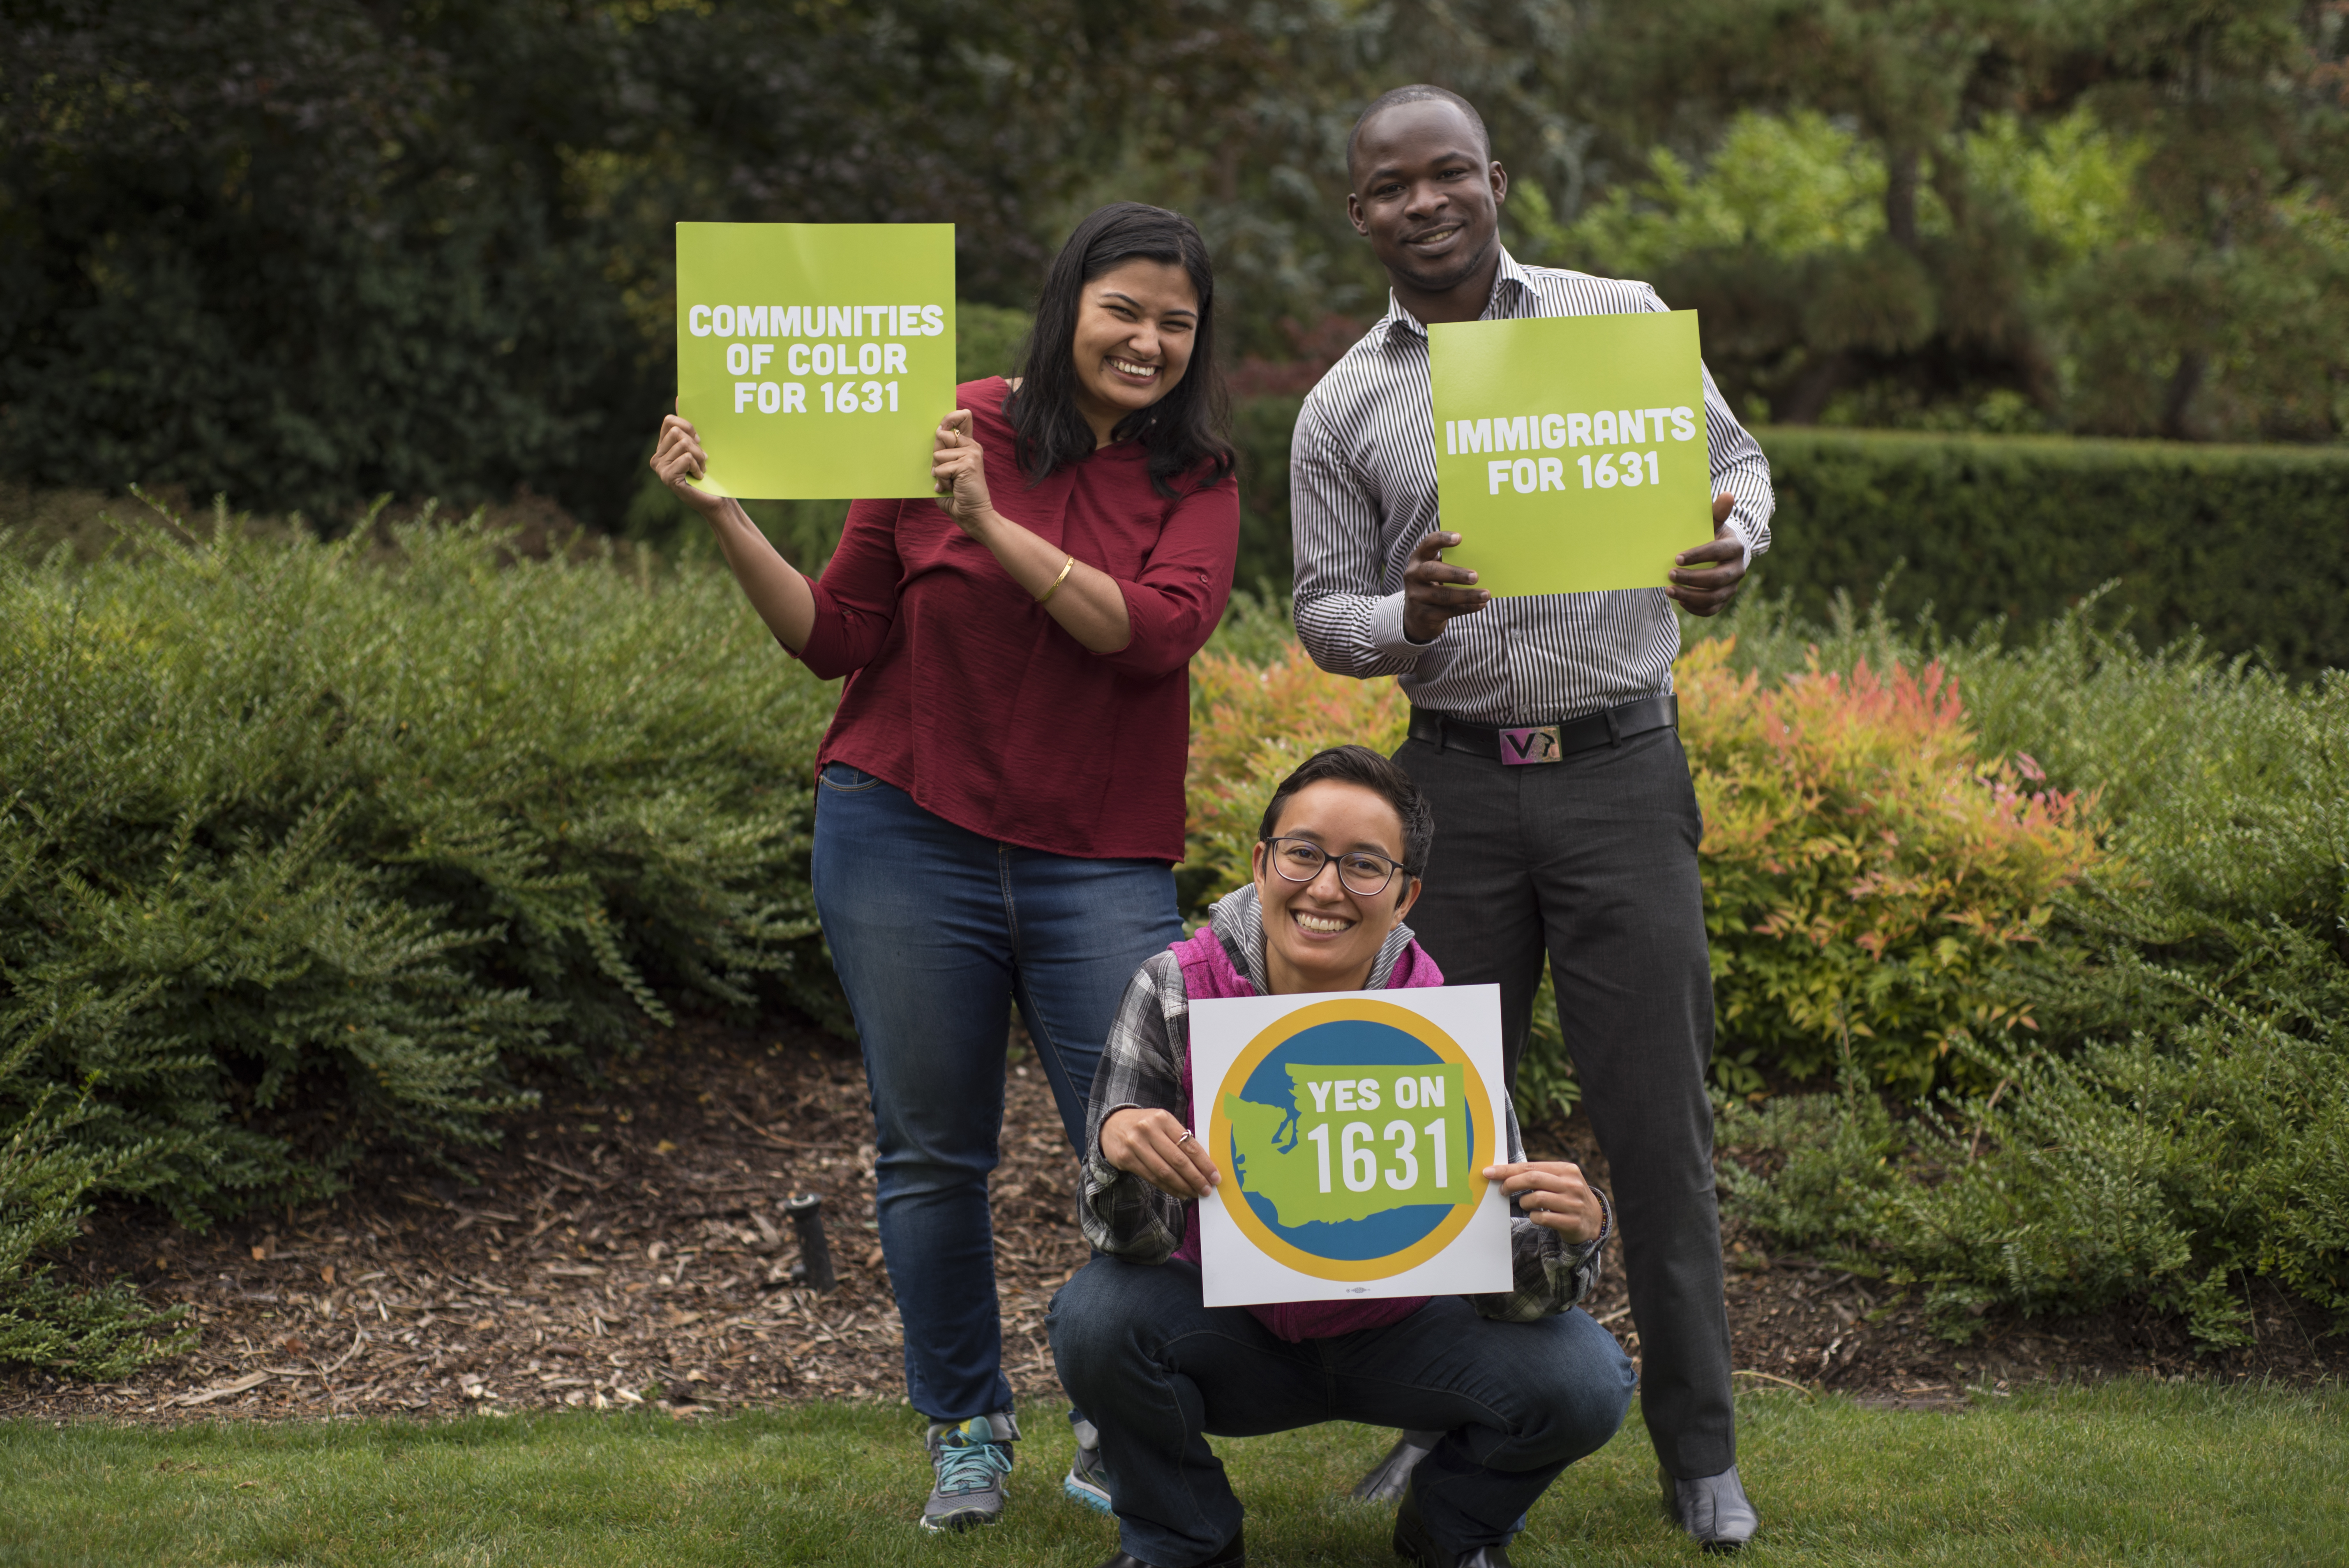
I-1631 is a game changer for people of color in Washington. The net benefits of investing in clean energy and pollution clean-up will include improved health, thousands of good jobs, lower energy costs, and a boost for local economies.

In a previous article, we broke down the ways that I-1631 will invest in communities most harmed by fossil fuel pollution – places and people that are disproportionately people of color. In a follow-up article, we explored the myriad ways that the fossil fuel industry makes communities of color pay with their health and safety – but also how much we will benefit when dirty fuel corporations end those practices. In this article, we show how the sum of the benefits greatly outweigh any costs. We project that I-1631 will result in:

  • At least $450 million a year in clean energy and pollution clean-up that meaningfully benefits our communities.
  • $171 million a year savings in health costs due to reduced vehicle pollution, just in the Puget Sound region.
  • Economic relief for individual households impacted by pollution-triggered respiratory disease, like asthma and heart conditions.
  • Long-term benefits to our state economy and our communities that could see a return of up to $30 dollars for every $1 invested.
  • Creation of at least 8,500 jobs a year that can provide opportunity for people with barriers to employment in green jobs. This number increases each year as investment increases.
  • $100 million a year for energy rebates and bill assistance for lower-income households.
  • Less than $9 a month cost to low-income households that don’t take advantage of energy rebates. That’s less than a Netflix subscription.
  • Lower-income households (making less than $40,000 a year), as a group, would pay less than 24% of the total share of the fee. Higher income households would bear most of the cost because they spend far more on energy, including gas and utilities.

Optimizing Benefits to Our Communities

By design, I-1631 creates both short-term and long-term economic gains for individuals and our communities. Evidence from decades of research on the costs of pollution (and benefits of regulation) shows that society makes big gains when polluters are held accountable.

Investments to Clean Up Pollution and Create Clean Energy

The new carbon fee will create about $1 billion a year in revenue that will be invested in cleaning up Washington’s fossil fuel pollution. At least 45% of the investment will be prioritized for communities that have been harmed the most by pollution or who need inclusion in a clean energy future. This will result in hundreds of millions every year for our communities, including public health, public transit, locally-owned energy, resiliency to weather events, and rebates to people struggling to meet their utility bills.

Health Cost Savings from Reduced Pollution

The Puget Sound Clean Air Agency (PSCAA) found that the clean energy investments from I-1631 could cut the worst of fossil fuel pollution, the tiny chemical particles that go deep into our lungs, by 50% per year in Kitsap, King, Pierce and Snohomish Counties.1 These are the same particles linked to asthma and heart conditions which disproportionately affect communities of color. Using the same cost model as the PSCAA, we estimate that this could result in $171 million a year savings in pollution-caused health costs.2 And that’s just estimating for the four-county area overseen by the PSCAA, and just for reduction of pollution from highways (e.g., no industrial facilities or buildings).

At an individual level, reduction of air pollution can have significant health benefits to households with someone suffering from asthma or heart conditions. Treating asthma cost an average of $3,266 per year in medical expenses, including office visits, medications, and emergency room visits.3 With dramatically fewer fine particles of pollution in the air, families can worry less about asthma triggers for their children and elders.

Long-Term Economic Benefits

Fossil fuel corporations have a dirty little big secret they don’t want to get out - regulations that clean-up pollution comes with enormous benefits compared to the costs. In a comprehensive study, the U.S. Environmental Protection Agency’s estimated that from 1990 to 2020 the Clean Air Act would generate $12 trillion dollars in economic benefits for only $.38 trillion in investment.4 In other words, for every $1 dollar invested, the U.S. would get back $32. With I-1631’s combination of a carbon fee to raise funds and investments in clean air and water, we can imagine an economy with more money to circulate locally among workers, small businesses, and communities.

Good Green Jobs for Our Communities

I-1631 investments will generate thousands of jobs per year in Washington, with provisions to ensure people who need jobs the most have opportunity to start new careers in the green economy. In California, researchers have found that a carbon policy with similar priorities to I-1631 has created 8.5 jobs for every million dollars invested.5 Over half of those jobs have been created in “disadvantaged communities,” similar to I-1631’s health action areas, which prioritize communities harmed the most by pollution.

Using this estimate, we can expect that the investments from I-1631’s Clean Up Pollution Fund to create at least 8,500 jobs per year by 2022 (when the Clean Up Fund reaches $1 billion annually).6 These jobs could be building solar farms, upgrading energy efficiency in homes, operating new public transit, constructing affordable housing near transit, or preventing wild fires. I-1631 also requires that jobs created from the Clean Up Pollution Fund pay good wages and benefits and create a preference for hiring from local communities through Community Workforce Agreements. I-1631 will create green job opportunities for our communities across the state.

Minimizing Costs to Our Communities

The Washington Budget and Policy Center estimates that the cost of I-1631 will amount to $13 per household in Washington State in the year 2020 (this amount will go up marginally every year).7 They calculated this by dividing the total number of projected households in Washington in 2020 (2,969,980) by the total amount carbon fee generated by individual consumption of fossil fuels ($472 million). The Center concludes “That’s a small price to pay for cleaner air, healthier communities, and more efficient energy and transportation infrastructure.”

We agree, but there’s even more to the story about households costs and who will pay the most.

Fact #1: A conservative estimation of costs assumes that the carbon fee will be passed on entirely through higher fuel and utility costs to individuals and their households. However, I-1631 provides fossil fuel companies the opportunity to take responsibility for the harms they create by digging into their own profits – profits which were enlarged by the Trump tax cut by $25 billion dollars.8 To the degree that the fossil fuel companies are truly committed to reducing pollution and climate change, less than the full carbon fee may be passed on to consumers.

Fact #2: I-1631 directs 10.5% of the Clean Up Pollution Fund to energy rebates for lower-income households. Through a combination of bill assistance for utilities and subsidies for energy efficient vehicles or homes, I-1631 relieves lower-income households of rate increases, if any. In 2022, over $100 million in the Clean Up Pollution Fund will be available for this kind of assistance.

Fact #3: Because lower-income households purchase less fuel and energy than higher-income households, they would also pay less for the carbon fee. Even if all carbon fees are passed on to consumers, including vehicle fuel and utilities, the bottom third of households in income (making less than $40,000/year) would pay only $8.80 a month, less than a Netflix subscription or bag of popcorn at the movies.9 If fact, the bottom third of households will contribute about 24% of the total revenue, yet will get back up to 45% of the investments in the form of energy rebates and projects built to benefit their communities.

Despite these facts, I-1631 opponents will have us believe is the same old, tired story: that our interest as consumers is aligned with their interests as corporations, e.g., what’s good for big oil is good for Washington. In fact, their profits literally depend on pushing the hidden costs of dirty fuel onto everyone else. Corporate polluters have minted a fortune damaging our air and water, passing along costs and consequences to the working people of our state. It’s no wonder that oil giants BP, Phillips 66, and Marathon Oil have poured more than $25 million into opposing I-631.

In truth, we all have far more to gain together as consumers, communities, and citizens from a carbon fee. In particular, the net benefits for lower-income households and people of color far outweigh potential costs.

By joining together, from Eastern Washington to our coast, we can demand safe, clean, locally-made energy, generate resources to support people struggling to make ends meet, and ensure our well-being for generations to come. When we vote for I-1631, acting responsibly for our people, air and water, we’re truly all better off together, no matter what dirty fuel lobbyists say to scare and distract us from the harms they've created.


1. Puget Sound Clean Air Agency, Neutral Factual Analysis of Initiative Measure No. 1631: Potential Air Quality Impact in the Puget Sound Region, October 2018. Accesses on 10/18/18 at http://www.pscleanair.org/DocumentCenter/View/3497/I-1631_NeutralAnalysis.
2. Following the PSCAA method, we used the EPA’s COBRA health impacts model (version 3.2.1), with 2025 as the analysis year, and using 7% discount rate for King, Kitsap, Pierce, and Snohomish counties. The model can be found at https://www.epa.gov/statelocalenergy/co-benefits-risk-assessment-cobra-health-impacts-screening-and-mapping-tool.
3. Nurmagambetov T., Kuwahara R., and Garbe P. “The Economic Burden of Asthma in the United States, 2008–2013,” Annals of the American Thoracic Society, 2017. Accessed on 10/18/18 at https://www.atsjournals.org/doi/pdf/10.1513/AnnalsATS.201703-259OC.
4. U.S. Environmental Protection Agency: Final Report – Rev. A, The Benefits and Costs of the Clean Air Act from 1990 to 2020, April 2011. Accessed on 10/18/2018 at https://www.epa.gov/sites/production/files/2015-07/documents/fullreport_rev_a.pdf.
5. J.R. DeShazo, Jason Karpman, Weilong (David) Kong, and Colleen Callahan, Employment Benefits from California Climate Investments and Co-investments, UCLA Luskin Center of Public Affairs, 2018. Accessed on 10/18/18 at http://innovation.luskin.ucla.edu/sites/default/files/Employment%20Benefits%20from%20California%20Climate%20Investments%20and%20Co-investments%20-%20Low%20Res_0.pdf.
6. We applied the 8.5 jobs per million from the study above to the $1 billion amount in revenue for 2022.
7. Nichols, Andy, “I-1631 invests in what matters,” Washington State Budget and Policy Center, Oct 2018. Accessed on 10/23/18 at https://budgetandpolicy.org/schmudget/i-1631-invests-in-what-matters.
8. Antonia Juhasz, “Inside the Tax Bill’s $25 Billion Oil Company Bonanza,” Pacific Standard Magazine, March 27, 2018. Accessed on 10/18/18 at https://psmag.com/economics/tax-bill-oil-company-bonanza.
9. To estimate the share of carbon fee for individual households by income, we used the US Bureau of Labor Statistics’ Consumer Expenditure Survey (CES), 2016-2017, for the western region of the U.S. Specifically, CES Table 3133 provides average annual expenditures by income bands, including breakouts for gas, oil, natural gas and electricity. For households in the bottom 1/3rd of income, we averaged together all income bands below $40,000/yr, then calculated their share of energy expenditures relative to all households. We then applied that ratio to the estimate provided by the WA Budget and Policy Center (see footnote 6). The CES can be found here: https://www.bls.gov/cex/.

Initiative 1631: How does it work? And what is in it for Our Communities?

By Debolina Banerjee, Katrina Peterson & Howard Greenwich

I-1631 offers low-income communities and people of color in Washington an unprecedented opportunity to heal decades-worth of harm from fossil fuel pollution and create a clean environment for our children and future generations.

Unlike past efforts to curb carbon pollution, the initiative is designed with equity as a core principle for transitioning from dependence on fossil fuels (oil, coal, and natural gas) to cleaner forms of energy. Specifically:

  • 35% of the money generated from 1631’s carbon fee will be spent on, and in, communities that have borne the most harm from fossil fuel use.
  • Another 10% of the money will be used to provide energy rebates to low-income households and ways to reduce energy costs for low-income communities.
  • By 2022, at least $450 million a year will flow back to the communities that bear the highest burdens and highest risks from climate change and the transition to clean energy.

Clean Up Pollution Fund

I-1631 starts by creating new, state-wide program called the Clean Up Pollution Fund. Major users of fossil fuels (including the oil industry and utilities that haven’t switched to clean energy) will pay into the fund based on how much pollution they emit. This carbon fee will increase incrementally each year until the State’s long-term, greenhouse gas reduction goals are met. State budget officials expect the fee to generate over one billion dollars a year by the year 2022.1

Overall, the Clean Up Pollution Fund can only be used by state agencies to reduce the State’s carbon emissions and mitigate unfair burdens of pollution and the transition to clean energy. The Clean Up Fund will be split into three sub-funds, whose investments and programs will benefit all communities in Washington:

Clean Air and Energy Investments (70%). Examples include:

  • Create new solar, wind, tidal, and geothermal power generation
  • Increase energy efficiency of existing buildings, such as weatherizing homes and apartment buildings
  • Replace dirty diesel trucks, buses, and equipment with clean energy vehicles
  • Increase transit service and capacity throughout the state
  • Decrease industrial pollution
  • Support fossil fuel workers impacted by transition to clean energy

Clean Water and Healthy Forests (30%). Examples include:

  • Restore shorelines and estuaries (like the mouth of the Duwamish) and prepare for sea level rise
  • Reduce flood risk
  • Reduce pollution draining into waterways and lakes
  • Increase resilience to wildfires in the face of increased temperature and drought (which will also help reduce smoky air)

Healthy Community Investments (5%). Examples include:

  • Wildfire preparedness and prevention
  • Relocating communities on tribal lands impacted by flooding and sea level rise
  • Community education on how climate change will affect places throughout the state and how we can prepare for it

High Priority Given to Communities at Highest Risk

I-1631 sets out clear equity guidelines to ensure that those most impacted by pollution benefit from I-1631, such as low-income communities, communities of color, rural communities, Tribal Nations, and others. These guidelines invest 45% of the Clean Up Pollution Fund in communities most impacted by fossil fuel pollution and climate change. Doing so directly reduces pollution at its source, in turn benefiting all communities.

The initiative defines four major groups who must benefit from the Clean Up Pollution Fund, which include:

Vulnerable populations: These are communities experiencing additional harm from fossil fuel pollution and climate change, due to factors like high unemployment, lack of affordable housing, linguistic isolation, and health challenges.
Indian tribes: These communities include Indian nations, tribes, bands or other entities.
People with lower incomes: This includes Washington residents with an annual income below 200% of Federal the poverty line or who have less than 80% of the average income in their region.
Affected workers: These include workers in industries that will be affected by the carbon fee, such as refinery workers or construction workers that build and maintain fossil fuel infrastructure.

Although 1631 does not specifically call out race as a factor for determining how to prioritize carbon fee revenue, people of color face many of the listed barriers and challenges more so than white people in Washington. They are more likely to live close to pollution, experience worse economic conditions, fare worse during climate events, and live with poorer health.

Pollution & Health Action Areas

In addition to the above groups, I-1631 creates a place-based focus for investment from the Clean Up Fund called “Pollution and Health Action Areas.” These action areas include urban neighborhoods, tribal lands, and rural areas where residents bear both a higher brunt of fossil fuel pollution and social and economic disadvantages.

This strategy parallels California’s climate policy, which directs investment of that State’s climate fund to “disadvantaged” communities, based on a similar combination of conditions.) The action areas have not been fully identified yet, but a group of researchers from the University of Washington and Front and Centered are already crunching the numbers to figure it out.


How Will Our Communities Actually Benefit?

I-1631 establishes two ways for carbon fee revenues to lift up communities hit hardest by fossil fuel pollution:

  1. The initiative requires that at least 35% of all carbon fee revenues “provide direct and meaningful benefits to pollution and health action areas.”
  2. An additional 10.5% must be spent to “directly reduce the energy burden of people with lower incomes.”

In total, that’s over 45% of the funding, amounting to nearly half a billion dollars annually, once the fee has been in place a few years. We show how this works with a handy infographic, embedded further below. You can refer to it as we explain how the two mechanisms work together.

35% to Provide Direct and Meaningful Benefits to Action Areas

Over a third of I-1631 revenues will be invested in communities hit hardest by carbon pollution because doing so reduces pollution at its source.

Once the action areas are defined (for now, think about areas with higher than average poverty, unemployment, and pollution), State agencies will spend the 35% on programs, projects, and local efforts that benefit the people who live there. As an example, Sound Transit could use carbon fee revenue to establish a new bus rapid transit line that connects a health action area to good jobs elsewhere in the region. Even though the bus line would go well beyond the action area, the whole investment would count because it provides direct benefits to the people who live there.

10% of the total carbon fee has to be spent inside the boundaries of the action areas. For example, I-1631 revenue could be spent on a program to install solar panels on homes owned by low-income households, which would reduce electric bills. However, a project that just installs solar panels in neighborhood open space and only generates electricity for a utility would not directly benefit the community, so would not count towards the 10%.

In addition, 10% will be spent on activities or projects that have been prioritized by tribal communities. This priority recognizes that tribal communities have been leaders in addressing climate change, largely because they have the most at stake.

Note that the above 10% for tribal priorities and the 10% located within action areas stack towards the overall 35%. To illustrate, $35 out of every $100 dollars spent will go to action areas. Of that $35, $10 must be for projects located in the action areas, and $10 will go to tribal priorities.

The initiative language provides a lot of flexibility to meet community needs and allow for community decision-making. The initiative allows for creative solutions to reduce carbon pollution and address climate change risks, including:

Investments that address the underlying conditions that make climate change impacts worse for vulnerable communities. For example, construction of a new energy facility that requires hiring unemployed workers in action areas would increase community income and stability.

Investments that make communities more resilient in the face of climate change, which could include investments that address food security, extreme weather events, and community health during smoky days. For example, carbon revenue could be used to bolster the non-governmental emergency response capacity of local cultural centers and service providers.

Meet a community need identified by residents of health action areas. For example, a low-income community with high risk of increased flooding could identify a project that expands surrounding wetlands to absorb flood waters.

Directly Reduce Energy Burdens

I-1631 recognizes that low-income households pay disproportionately for energy use, whether heating homes or paying for gas. The initiative requires that 10.5% of carbon fee revenues go to reducing energy costs for low-income households, by reducing existing disparities or addressing any new ones created by the carbon fee. (The 10.5% is another way to mathematically represent the 15% of the Clean Air and Clean Energy Fund dedicated to reducing energy burden. That fund will receive 70% of all carbon fee revenue. 15% of 70% is equivalent to 10.5% of the entire Clean Up Pollution Fund.) More importantly, this 10.5% is separate from the 35% directed towards health action areas. Households with lower incomes throughout the State can benefit, not just those in the action areas. I-1631 specifies the following uses for this set-aside:

  • Energy affordability through bill assistance and rebates
  • Reduction in dependence on fossil fuels for transportation, e.g., real alternatives to driving to work alone
  • Reduction in household energy consumption - which ultimately reduces energy bills
  • Community-owned renewable energy

Another provision in I-1631 makes energy bill assistance for low-income households an important outcome – utilities that owe carbon fees to the State can keep the money, as long as they make the same investments required under I-1631’s Clean Air and Clean Energy Fund. Let’s say a utility that provides natural gas owes the State $10 million for a given year. The utility can retain the $10 million, but must also use it on renewable energy projects, energy efficiency, and/or rebates on their energy bills for low-income households, just like the State. This includes the 10.5% set-aside for relieving disproportionate energy burdens. The good news is that utilities across the state already have bill assistance programs. In addition, I-1631 requires state agencies and utilities to create robust outreach programs that ensures all eligible households can benefit from rebates.

How it All Adds Up

The chart below shows how I-1631 funding would flow into action areas, tribal areas, and communities most at risk from pollution and climate change. Note that the initiative does not require that 35% of each of the three subfunds be spent on health action areas – most or all could come from the Clean Air fund, for example. (For the sake of simplicity, we assume in this chart that 35% is set aside in each of the subfunds).

Graphic - How 1631 Benefits

How big a deal is 45%? By the year 2022, the Clean Up Pollution Fund will generate about $1 billion in revenue. That means $350 million will flow to health action areas and $100 million will be used to reduce energy burdens. Put another way, 2 out of every 5 dollars generated by I-1631 will be invested in communities most impacted by pollution and climate change because doing so reduces pollution at its source and benefits everyone.

You can see from the table below how all of the percentage requirements translate into scale of funding. Although we use the year 2022 as our example (because the revenue will be close to an even billion dollars), spending on community priorities will begin as soon as the first fees are paid into the Clean Up Fund.2 Highlighted in the table is that more than $100 million will be spent on relieving energy burdens for low-income households. Note, again, that the 35% for action areas applies to the whole Clean Up Fund and not individually to each subfund. However, for simplicity, we show it coming out of each.

I-1631 is the transformative policy we need to address the urgent problem of carbon pollution and climate change. By centering those most impacted by carbon pollution, this policy reduces emissions right at the source and benefits everyone. It resources our communities to build out the clean energy economy while simultaneously reducing our dependence on fossil fuels. I-1631 protects those most vulnerable during the transition. It provides assistance to those who can’t afford their energy bills, resources for workers transitioning out of the fossil fuel economy, and support for communities on the frontlines of carbon pollution and climate change impacts.

As a member of Front and Centered, a coalition of people of color-led organizations through Washington, we are proud to support a policy that lifts up all by lifting up those most impacted by pollution, because doing so strategically reduces carbon pollution at the source. We are excited to advocate for clean air, clean water, and clean energy for all!


1 All estimates of revenue generated by I-1631 in this article comes from a fiscal impact analysis by the Washington State Office of Financial Management. The analysis can be found here: “I-1631 Reducing Pollution,” Accessed Oct 10, 2018, at https://www.ofm.wa.gov/budget/fiscal-impact-ballot-measures-andproposed-
legislation/2018-general-election-ballot-fiscal-information. The total amount of revenue generated by the carbon fee includes both revenue to state accounts combined with credits that public and private utilities will contribute if they take credit for their own investments under I-1631 requirements. The projection on how much private utilities will take credit for can be found in supplemental spreadsheets provided by OFM upon request.
2 See endnote 1.

Introducing Yolanda Matthews

By Linda Gasparovic

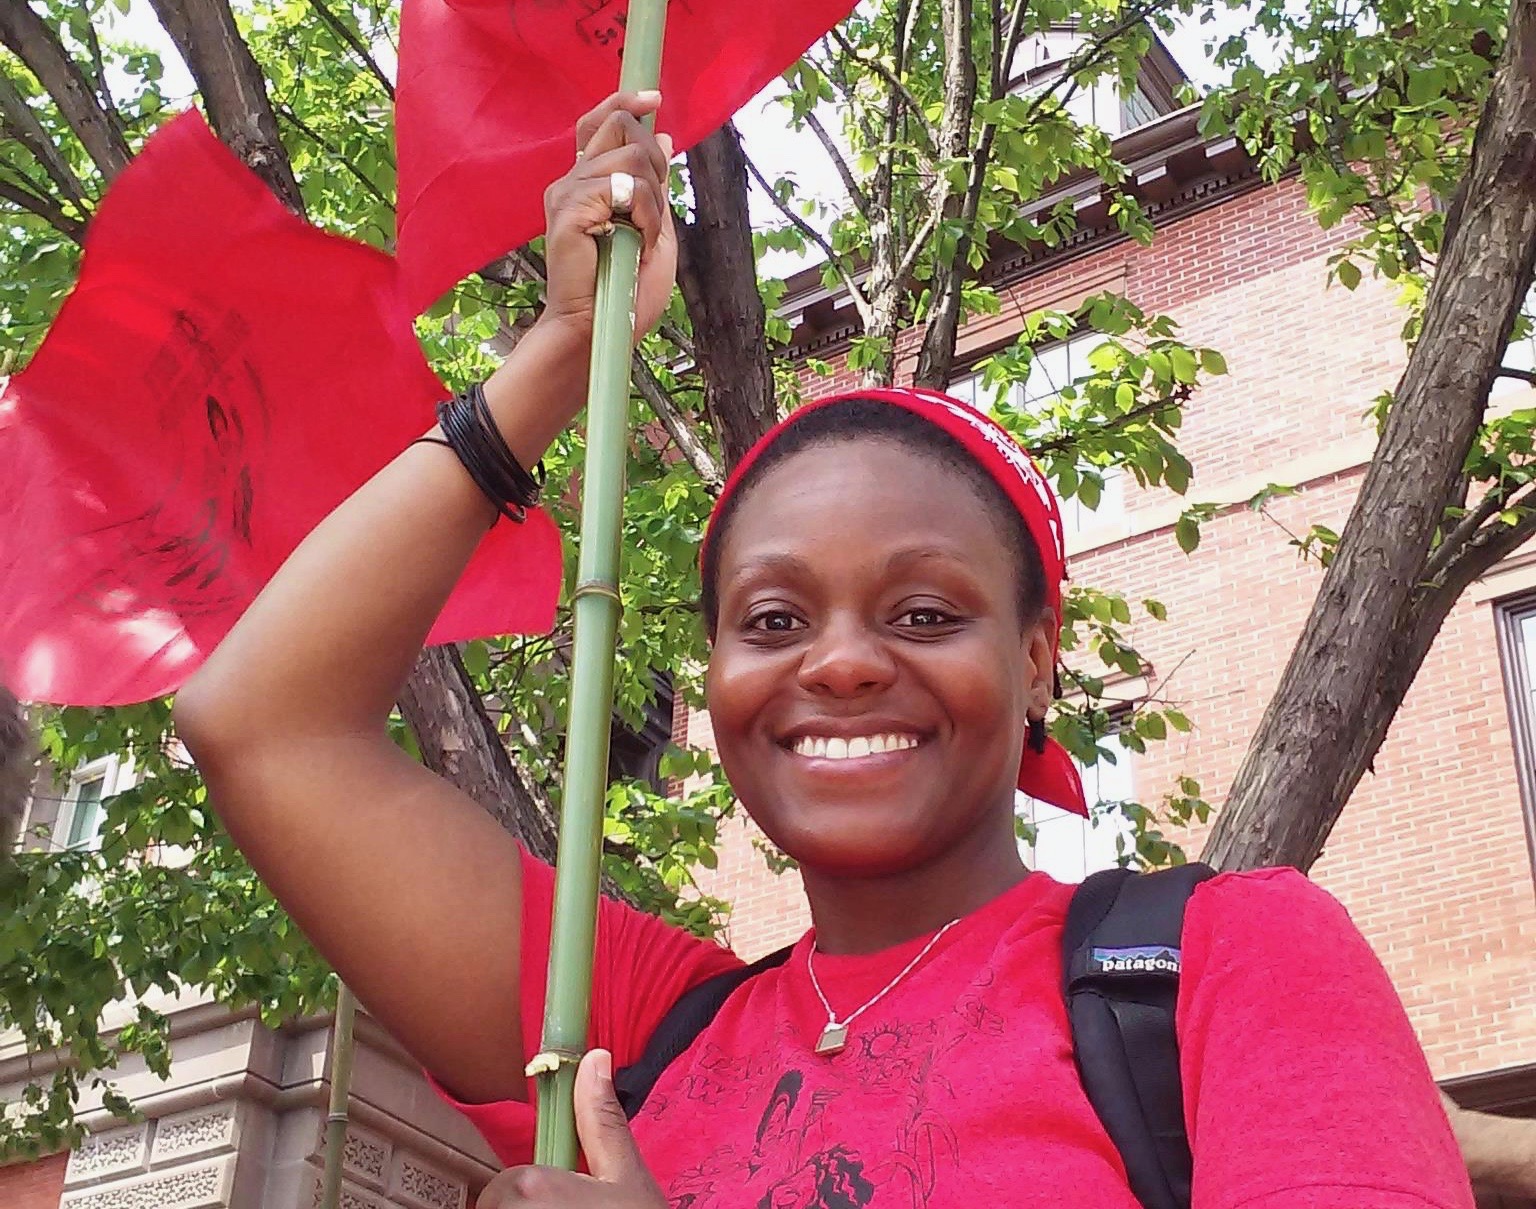
We are excited to introduce Yolanda Matthews, a Rainier Valley Corps fellow who will be serving as the Coalition Organizer of Sage’s Interfaith Economic Justice Coalition!

Yolanda, a native Bostonian who moved to Seattle six years ago, will be responsible for coordinating interfaith support of worker organizing through Sage’s Interfaith Economic Justice Coalition (IEJC). By facilitating conversations and action between faith leaders, unions, and workers, Sage and the IEJC hope to bring a faith perspective to economic inequities in the region.

She brings four years of experience with Got Green through their Young Leaders Program and more recently as a member of the Food Access Team and their Board of Directors. While this is Yolanda’s first foray into the professional side of community building and organizing, she has years of experience in grassroots social justice work. “Being on the ground marching, rallying, protesting, door knocking, strategizing, testifying,” she recalls, “were the social justice tools that I needed to acquire in order for me to be rooted in my work today.”

Yolanda can be reached at yolanda@pugetsoundsage.org. Please join us in welcoming Yolanda to our Sage community!

Staff Spotlight

How did you first get involved with Rainier Valley Corps?
I became involved with the Rainier Valley Corps when I attended the inaugural celebration in honor of the first cohort of RVC fellows. I had been encouraged to apply for the first cohort, but because of school commitments I was unable to participate at that time. However, I was still interested and able to keep abreast of RVC’s activities through their e-blasts.

What was your first impression of Puget Sound Sage?
My first impression of Puget Sound Sage was formed four years ago when I started volunteering with Got Green. While I didn’t know much about Sage at the time, I began hearing about their work through the grapevine and thought, “they must be a great organization if Got Green is collaborating with them on so many projects!” I was also becoming more aware of just how hard they work on influencing policy.

What are you most excited for during your time with Puget Sound Sage?
I really look forward to helping mobilize folks who have the dignity to stand up for what they know are their rights as human beings, and holding local government accountable to the jobs we elect them to do. I am excited to be working with an organization that has such intentionality in making sure that when major decisions on equity are being made in Seattle, the families of color who contribute to the diversity of our neighborhoods have the first seat at the table!

What might someone be surprised to know about you?
I come from a large extended family (my mother is one of 11 children, so I claim 28 first cousins, 27 or so second cousins, and 5 or so third cousins that still reside in my hometown of Boston)! I am a vegan home chef who enjoys experimenting with ingredients and embraces all aspects of healthy living. I’ve been secretly interested in getting my scuba certification for the past 10+ years… maybe now that I’m stating it out loud, I might just work a little harder to actually realize the dream!

Seattle’s Minimum Wage Starts in Two Days (4/1/2015)

Seattle’s Minimum Wage Kicks in April 1st 2015

With Seattle’s new minimum wage kicking in just two days, and tons of speculation about the impacts, I’d like to break down what it means for workers, businesses and our economy in some hard numbers.

What does Seattle’s minimum wage mean for workers?

Everyone in Seattle should be earning at least $11 per hour starting on April 1st. Depending on the type of business you work for, the compensation package may look different. If you work for a large employer (500+ employees) like Target, McDonalds or Amazon, your paycheck should reflect an hourly wage of $11 per hour. If you earn minimum wage ($9.47) today, then in two days you should earn $1.53 per hour more before taxes. If you work 32 hours a week and are paid every two weeks, your paycheck should show an increase of $91 before taxes. By December 31st 2015 you should have earned $1,836 more before taxes. That is enough money to buy a quality bed, put down a deposit on an apartment, or spend $10 on lunch three times a week for an entire year.

If you work for a smaller business (500 or less employees) your paycheck should reflect at least $10 in direct wages per hour, and $1 dollar in either tips or health care benefits. If you don’t get tips or healthcare benefits, you should be earning $11 per hour as your wage. So for example, if you are a tipped worker, your wages should reflect a $.53 cent increase AND your employer should show that you have earned least $1 in reported tips or they have contributed at least $1 per hour you worked towards a health care package. If you work 32 hours a week and are paid every two weeks, your paycheck should show an increase of at least $31 in pre-tax wages and at least $60 in compensation in the form of tips or healthcare benefits. By December 31st 2015 you should have earned $636 more before taxes.

What does Seattle’s minimum wage mean for the economy?

The University of Washington[i] estimates that nearly 37,900 people are currently earning minimum wage in the City of Seattle. As we’ve already estimated, each person will earn between $636 and $1,600 more this year if they work 32 hours per week until December 31st.[ii] If we look at the aggregate increase for all 37,900 workers earning minimum wage – minimum wage earners in Seattle could earn between $24 million and $69 million more in 2015 than they would have without a higher minimum wage. That represents a significant increase in buying power for Seattle’s lowest wages workers. That’s enough money to buy between 2.4 million and 6.9 million $10 lunches.

What does Seattle’s minimum wage mean for businesses?

Every business has a different model and labor costs can represent a different percentage of your total labor costs. The implications for restaurants have been dominant in the media, so we’ll explore what the implications are for a Seattle restaurant. Using the Washington Restaurant Association’s break estimates of a typical budget breakdown featured in the Seattle Magazine, we can get a sense of the total operating costs.   According to Anthony Anton, CEO of the Washington Restaurant Association: 36% of funds are devoted to labor costs, 30% to food costs and 30% to everything else. These restaurants then operate on a 4% margin.[iii]

If we look at a $1 million dollar business, labor accounts for 360,000 of their total operating costs. Assuming all workers earn minimum wage (which means this estimate is looking at the largest possible increase to labor costs as the typical wage for cooks in our region is $11.27 per hour and the typical wage for dishwashers is $10.45 per hour)[iv] their labor costs should increase between 380,160 (if all workers are tipped) and 417,600 (if no workers are tipped).  It’s safe to say that the total labor costs will be somewhere between those two numbers.  Assuming 50% of work hours are tipped and 50% are non-tipped).  The largest possible increase to labor costs for this business would be 398,880 – representing a 10.8% increase in labor costs. However, what is that increase compared to total operating costs? With a 10.8% increase in labor costs, total operating is no longer 1 million, but 1,038,880 – a 3.8% increase in total operating costs.  A restaurateur could conceivably raise prices by 3.8% to make up the difference.  For a $10 meal, that is a 38 cent increase.  In short – in two days 38,000 people should see increases to their paychecks and some prices may marginally increase. By the end of the year – millions more dollars will have gone to the people who drive our economy – workers.

[i] https://www.documentcloud.org/documents/1096119-uw-evans-report-on-15-minimum-wage.html
[ii] By comparing the number of FTE’s in Seattle (Employment Security Department Data) to the total number of jobs in Seattle (Puget Sound Regional Council Data) we were able to come up with a rough estimate of the typical hours worked for an employee in Seattle – 1600 hours per year or 32 hours per week.
[iii] http://www.seattlemag.com/article/why-are-so-many-seattle-restaurants-closing-lately
[iv] According to 2014 occupational wage data at the Employment Security Department the median wage for cooks in the Seattle Metropolitan region is $11.27 per hour and the median wage for dishwashers is $10.45 an hour.